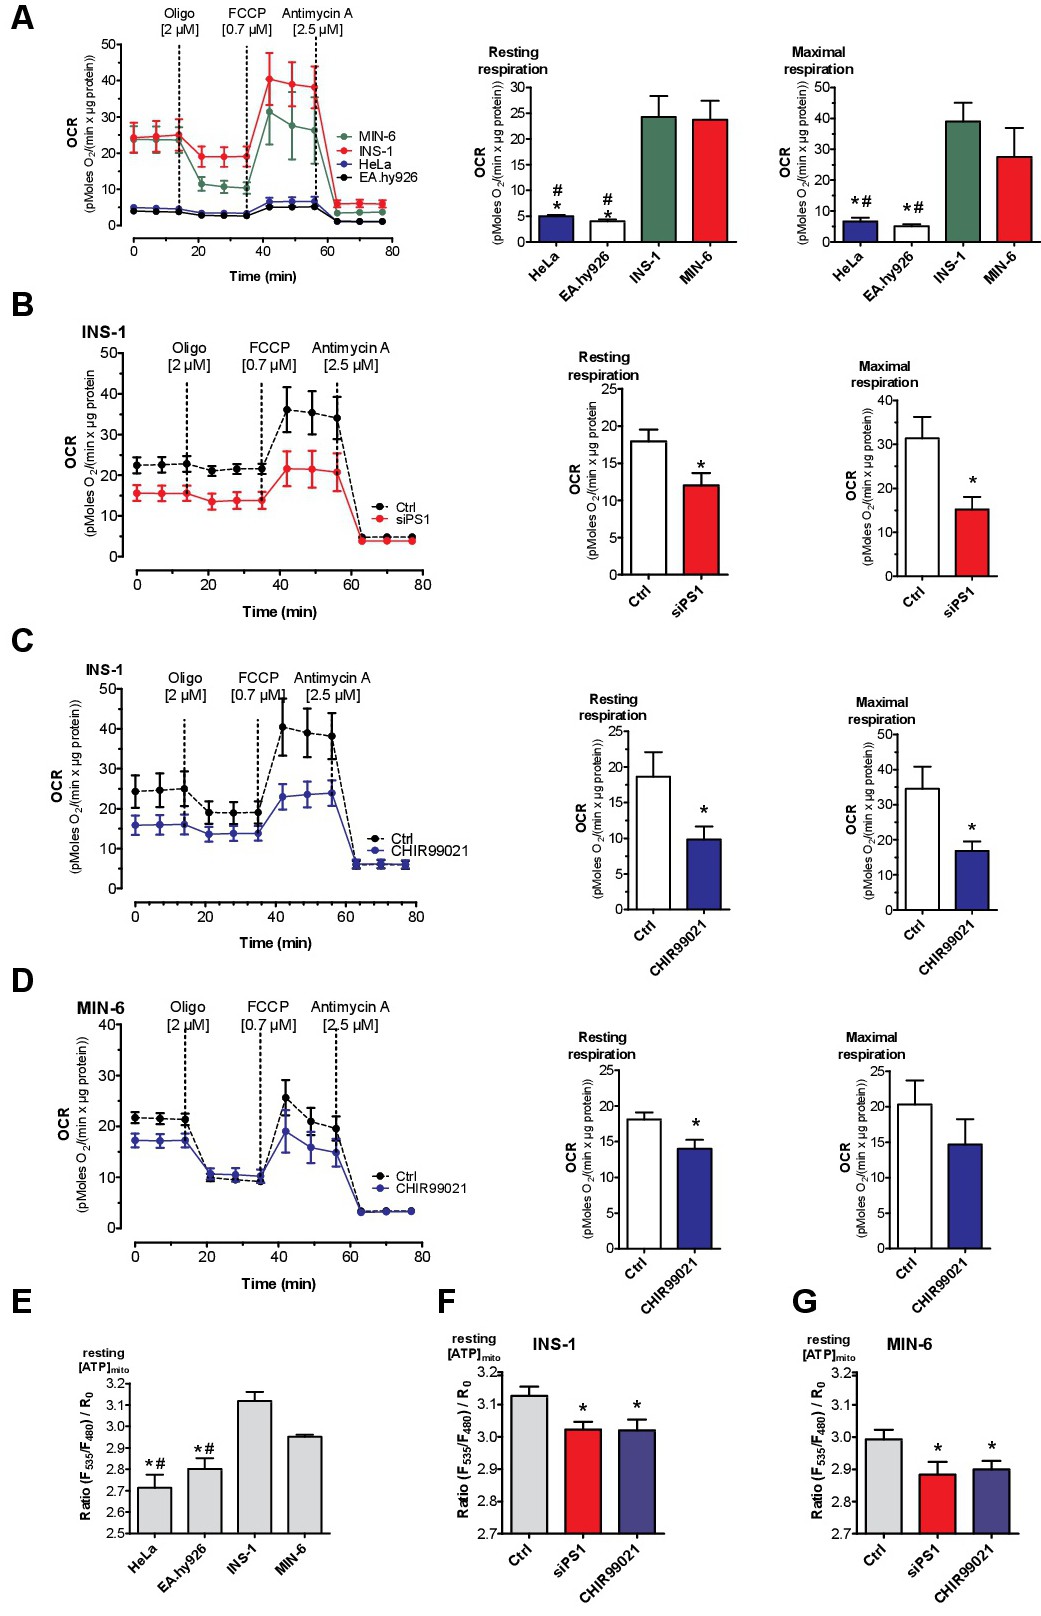
Fig. 8. ER Ca2+ leak fuels increased basal mitochondrial activity. (A) The mitochondrial respiration (OCR) in β-cells (INS-1: green line; MIN-6: red line) compared with that of non-β-cells (HeLa: blue line; EA.hy926: black line) under resting conditions. Bars on the right represent corresponding statistics of the resting (middle panel) and maximal OCR (right panel), mean ± SEM, *p<0.05 compared to INS-1, #p<0.05 compared to MIN-6 tested with one-way ANOVA. (B) OCR of INS-1 cells under control conditions (black dotted line) and knockdown of presenilin-1 (red line), bars represent corresponding basal and maximal respiration. (C,D) OCR of INS-1 cells (C) and MIN-6 cells (D) under control conditions (black line) or after treatment with the specific GSK3β inhibitor CHIR99021 for 48 h (blue line). Bars on the right represent basal and maximal respiration under control conditions (white bars) and after treatment with CHIR99021 (blue bars). (A-D) OCR was normalized to protein content. As indicated, cells were treated with 2 µM oligomycin, 0.7 µM FCCP for INS-1, EA.hy926 and MIN-6 and 0.3 µM for HeLa, and 2.5 µM antimycin A. Data present the mean values ± SEM (n=6). *p<0.05 versus control using the unpaired Student's t-test. (E-G) Bars represent basal [ATP]mito ratio measured with mtAT1.03 in HeLa, EA.hy926, INS-1 and MIN-6 cells under control conditions (E), or after knockdown of presenilin-1 (red bars) and prior treatment with 2.5 µM of the GSK3β inhibitor CHIR99021 (blue bars) in INS-1 (F) or MIN-6 (G) cells (n ≥ 6). #p<0.05 HeLa and EA.hy926 vs MIN-6 or *p<0.05 HeLa and EA.hy926 vs INS-1 in 5E or versus control in 5F and 5G using the unpaired Student's t-test or one way ANOVA where applicable (n=6).